
Cover image: Engraving of an wyvern-type ouroboros by Lucas Jennis, in the 1625 alchemical tract De Lapide Philosophico.
Every market regime is different. We currently find ourselves faced with a strong and resilient US economy, massive capital expenditures by U.S. Corporations, historic equity prices, historic market participation, equity multiples we haven’t seen since the dot-com era, an inevitable global energy shock, a new level of energy independence in the Americas and a government that has too much debt to significantly raise interest rates to fight a stagflation scenario.
If there’s one overarching principle in investing, it’s to buy low and sell high. Today’s cyclically adjusted earnings are historically overpriced, yet earnings and capital expenditure by AI hyperscalers are unprecedented. Current P/E ratios suggest that the market has already priced in aggressive growth potential of AI, which correlates with lower annualized equity returns over the following decade. Furthermore, the market is deeply discounting an unavoidable global energy shock. A P/E ratio between 15 and 17 is the traditional historical benchmark for broad market averages but remains a very poor timing signal. Put simply, massive capital is being deployed by technology and associated industrial companies, while the rest of the economic picture is bifurcated and “K-shaped.”
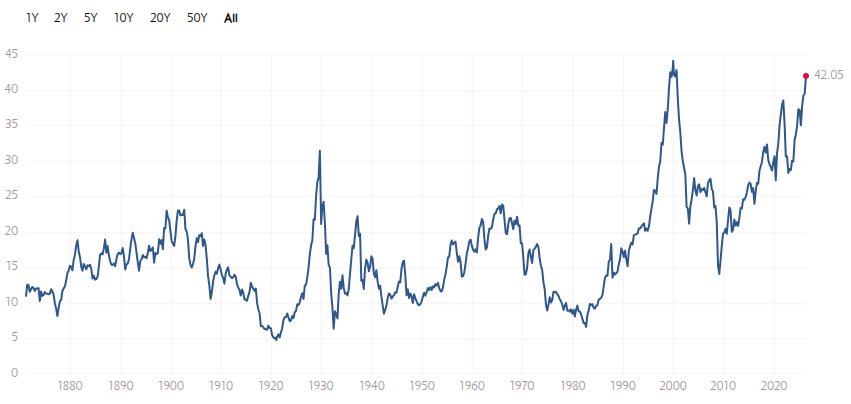
This market exuberance is driven by a rebound in the “AI trade” following positive earnings. The NYSE Semiconductor index has jumped ~40% in the past month following sideways moves from January through April. Blackrock’s corresponding SOXX semiconductor ETF is trading at a 59.28 P/E. NVIDIA is trading at a 43.92 P/E. The quarterly earnings beats by the semis seem to justify their rich price for now, but analysts note that those earnings are mostly due to margin expansion via generous vendor financing made possible by their stock price, which is eerily reminiscent of Cisco and telecoms in 2000. In other words, they are subsidizing the up-front costs of silicon and hoping their customers will pay them back with a profitable business model or “creative accounting.” Meanwhile, the free cash flows of major tech companies like Meta have dropped to historic lows and they are now issuing an unprecedented amount of bonds that already constitute a staggering ~15% of the corporate bond market, according to Morningstar. It’s unknown how structurally precarious the circular financing schemes in the hyperscaler buildout are, but the the future profitability of data center buildouts are a gamble that now involve major tech companies as major financiers with a massive concentration in both the equities and corporate bond markets.
No matter how you slice it, the AI hyperscalers are levering to the hilt, betting big on the “token toll booth” arms race and changing the balance sheets of their businesses for years to come. With stakes this high, the biggest risks are classic commodity traps or a major disruption to the unit economics where innovations on edge compute and model efficiency crater demand.
Companies positioned to play on “both sides of the wire” will have a strategic advantage.
Advanced Strategies:
- Trend Following – Rules-based trend following approaches vary, but momentum and volatility are popular signals. The market is currently trading above the 200 day moving average with nominal volatility, indicating a bullish risk on position, despite evidence the melt up was accelerated by a temporary gamma squeeze. Trend following is effective precisely because it doesn’t “sell the news” and react to macro headlines, but a 7% drop in total U.S. crude imports is hard to ignore. Oil futures remain below $100/bl.
- P/E Threshold Tactical Allocation – Macro geopolitical plus P/E or Shiller CAPE signals may warrant tactical allocation shifts by professionally managed funds in the coming weeks as profits are taken from the positive price action following strong earnings beats. This depends on the evolving geopolitical situation. There are a few general hedge approaches that individual investors may consider.
- Fixed Income Tilts – A modest temporary rebalancing to bonds or short-term treasury bills (4.45%) may be warranted to reduce price contractions that typically hit expensive, high-P/E sectors during market corrections. Because such timing is fraught with difficulty, modest progressive adjustments are best.
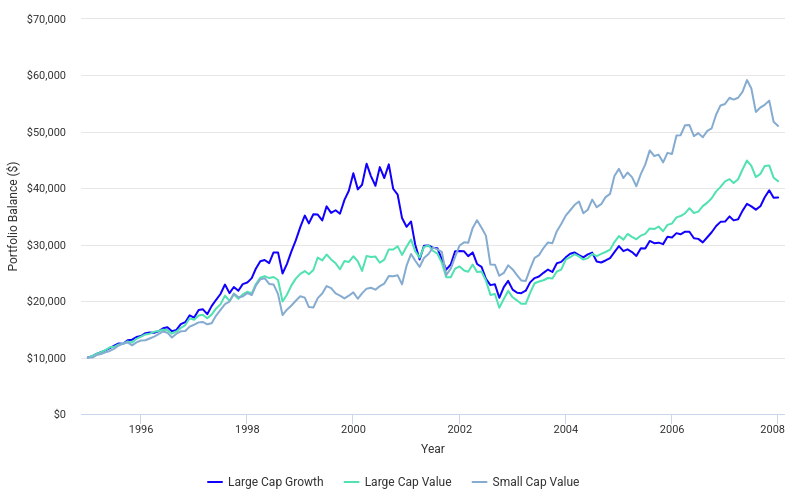
- Factor Tilts – Value and size factor funds offer a strategic advantage in a high-multiple market by narrowing the focus to undervalued stocks.
- Tactically tilting regular contributions toward value and size factors may reduce price contractions that typically hit expensive, high-P/E sectors. A popular position is 5-10% Small Cap Value that combines the size and value factors. If dollar cost averaging, all contributions could temporarily pivot to value and size factors.
- When the market mean reverts, contributions revert to a default strategy or to large cap growth to restore the portfolio closer to a market weighted distribution to maximize beta capture.
- These are foundational strategies for actively managed hedge funds, which use factor investing principles to guide portfolio turnover. VFMF is a low-cost ETF implementation of a strict rules-based factor approach whose holdings demonstrate an intriguing contrarian position.
To be clear, despite headwinds, the economy and market remains remarkably strong and resilient following strong earnings, but many investors may be blindsided by the prospect of an energy crisis, which could lead to a new macroeconomic regime. We’ve been conditioned to just buy the dip, assuming a quick recovery is always right around the corner. Investors may want to familiarize themselves with a more diverse toolkit that includes bonds, commodities and global value factor equities. Diversification across asset classes is key to managing through tough times.
The biggest blind spot for the average investor is usually commodities and real assets. Yes, the market holds commodity-related businesses, and one can add indirect exposure via sector ETFs, but it’s not as diversifying as commodity futures. While gold remains richly priced and gets all the headlines, non-gold commodities like oil, copper, and agricultural products are the real heavy hitters when prices for energy and food spike — the companies that produce them often thrive while the rest of the stock market is getting crushed.
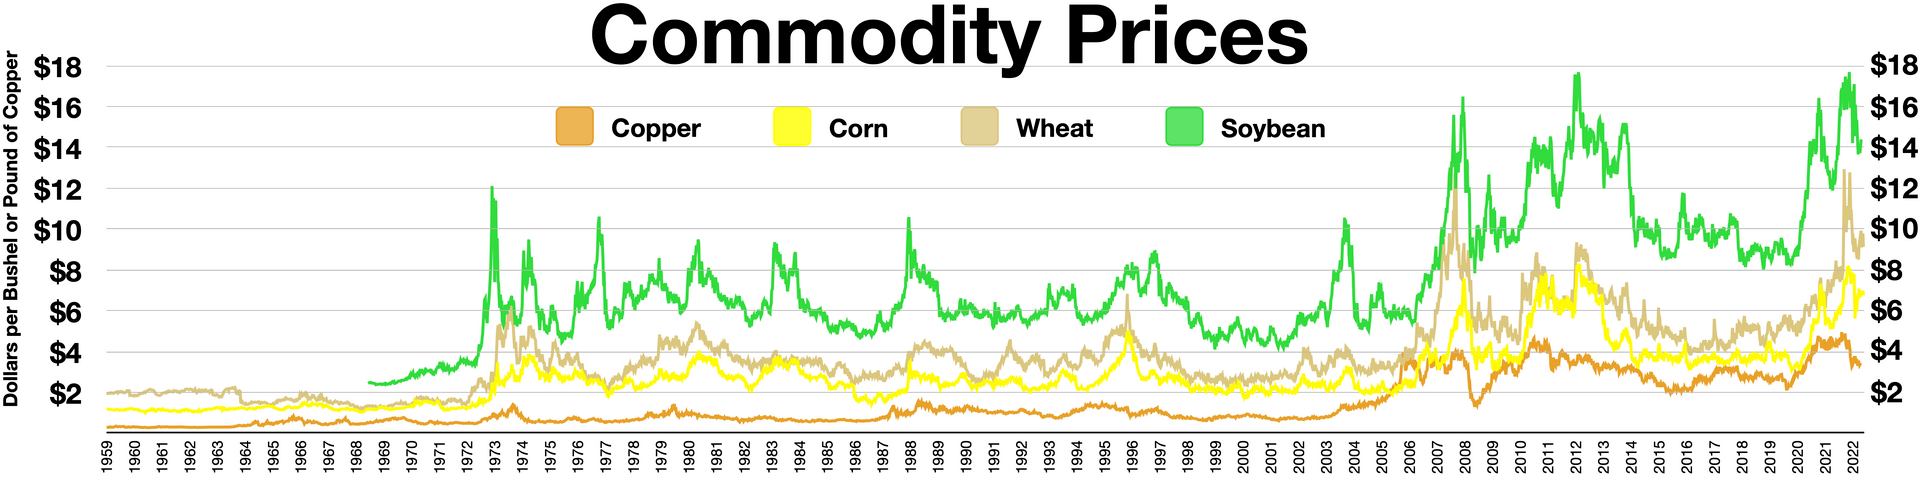
Commodities are a vital hedge because they often move in the opposite direction of traditional stocks and bonds while offering comparable long-terms returns. If an energy shock hits, having exposure to things like industrial metals or energy sources can protect a portfolio against a rising cost of living. To survive an era of stagflation as seen in the 70s (which had a very different demand-side demographic profile), investors would need to get familiar with the physical stuff that makes the global economy turn. One can now gain meaningful exposure to commodities via ETFs like, SPDR’s CERY that are reasonably tax and cost efficient. The high dividend yield (3.85%) is best held in a tax-advantaged account.
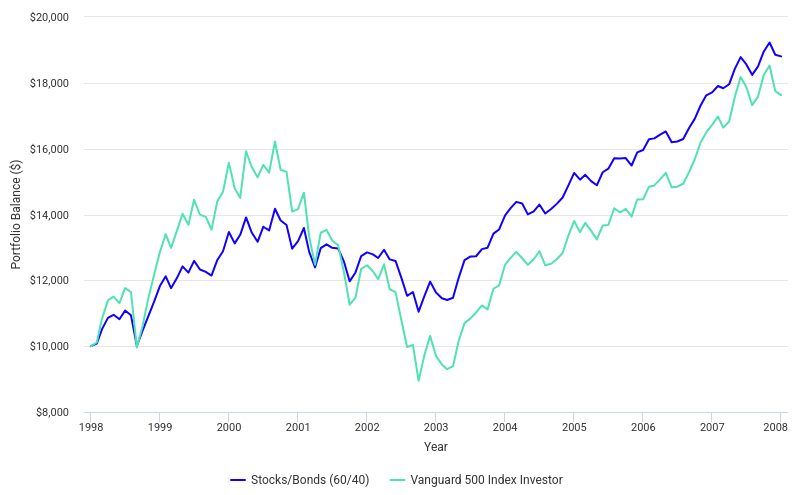
Many younger investors also brush bonds aside because they barely keep up with inflation. Bonds are not a growth investment — they are an essential tool for tactical de-risking and fixed income. Tactical allocation toward short term debt is still the best way to hedge against risk when markets are frothy. At the outset of 2026, Vanguard recommended 40% stocks and 60% bonds as the preferred moderate risk allocation for mature investors per their economic forecasts, and that was prior to the prospect of energy shortages.
Understanding bonds starts with the yield curve, which a simple line that plots the interest rates of bonds with different maturity dates, ranging from short-term debt to thirty-year bonds. In a healthy economy, the curve slopes upward and to the right because investors demand higher rates in exchange for locking their money away for a longer period. When the curve flattens or flips, it is a signal that the market expects the economy to stall.
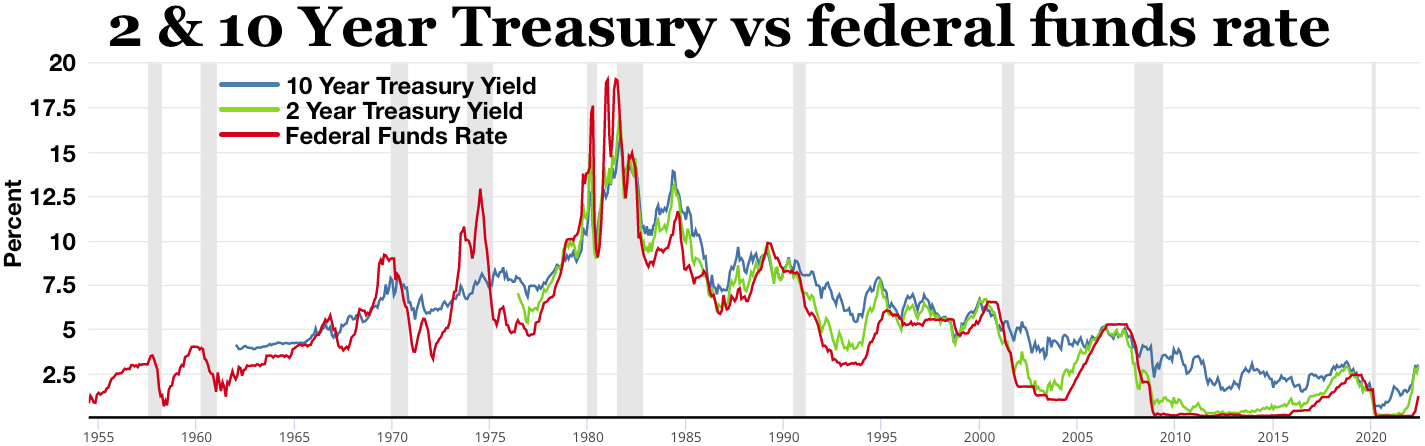
In a demand or supply-driven inflationary period, central banks use a tactic called yield curve control. They target a long-term interest rate and buy as many bonds as necessary to keep rates from rising above that level. They do this to keep borrowing costs low for the government and businesses, effectively pinning the curve down. While this can prevent a total financial collapse, it also limits the profit potential for traditional bond holders since rates are being artificially suppressed.
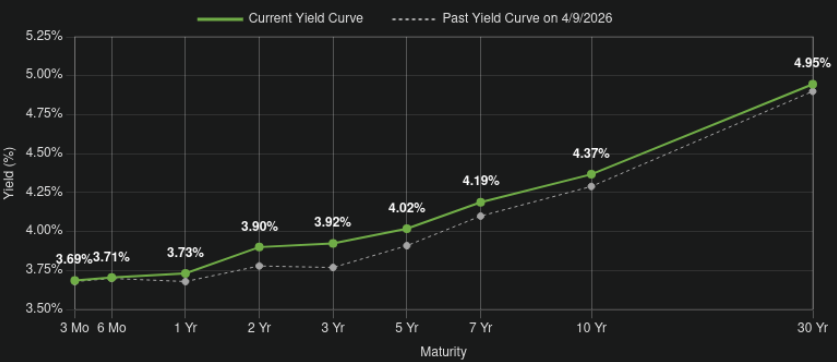
When yield curve control is in play, an investor has to be strategic about how they position their portfolio. Since the central bank is capping how high long-term yields can go, the traditional benefit of holding long-term bonds or the aggregate index is diminished. Investors often move into shorter-term bonds to stay flexible or look toward inflation-protected bonds like TIPS. In this environment, the goal is to protect against the loss of purchasing power while waiting for the central bank to cease intervention.
Inflation is not inevitable. The demographics of today’s economy are different than the 70s and 80s. Stagflation in the 70s saw a simultaneous explosion of demographic demand and supply-side constraints. We don’t have that combination today. Our aging population and reduced labor force growth trends are disinflationary, which offsets supply-side inflationary pressure. An energy-crisis-driven recession would simply result in demand destruction, which is deflationary. This could allow room for the usual playbook of quantitative easing and Keynesian-style stimulus, albeit at the expense of a potential sovereign debt crisis. The shadow of John Maynard Keynes still looms large over modern economic policy.
If all this seems too complex and scary, it’s also reasonable to just wait out the storm, stick to your plan and keep investing. To paraphrase Warren Buffett, the stock market is the only store where the average person lines up to buy when everything is overpriced and runs for the exits when everything is on sale. To take a page from Buffett’s own playbook, one could simply stop buying an overpriced market, load up on t-bills and wait until everything is selling for rock bottom prices.
It could be the opportunity of a lifetime or a futile exercise in Waiting for Godot. Time waits for no one.
Big Picture Macro Trends
If there’s one thing electric guitarists understand, it’s the magic of feedback. Standing in front of a cranked amplifier with a guitar, the interaction between the strings, pickups and speakers becomes an almost “living” system where the smallest change of position or touch changes the sound, ranging from a shrieking din of noise to a beautiful siren, like an arc of lightning. The live and loud guitarist learns to harness this raw power intuitively. One need only watch footage of Jimi Hendrix, who first unleashed this innovation to stunned audiences in the late 60s.
What does that possibly have to do with the stock market?
Well, the first time I read about the idea of an index fund that simply buys everything in a given market universe at a proportion of its capitalization weight, I intuited that it sounds like a system that could be susceptible to a feedback loop. Apparently, I’m not alone. It’s been a common question since index funds were introduced in 1975. The consensus among pro-index theorists is that as long as there is a reasonable percentage of investors actively participating in price discovery, passive index flows simply amplify the signal proportionally. They say that the “shape” of the market is not distorted, but the amplitude increases.
Regardless of whether you prefer to invest in index funds, pick stocks, or just use the default managed retirement mutual fund offered by your employer’s 401k, this affects you, as every stock in the market exhibits what’s called “beta”, which just means how much its price volatility correlates to the the larger market. When the market goes up, it’s a rising tide that lifts all boats. When the market goes down — well, you get the idea.
So let’s play devil’s advocate and question the assumption that index funds and passive investing don’t affect the market. After all, even the die hard pro-index enthusiasts agree that there is an unknown point where passive inflows start to have a systemic impact. I’d think we’re well on our way, if not already there.
First, we have to consider that there are a lot of different indices, and most of have an ETF or index fund that track them. The two most popular indices in the US market are the S&P 500 that includes 500 stocks and the various flavors of Total Market indices that include over 3000 tickers. Roughly 2.0–2.5 trillion of the US market is held in the 500 index, while $9–10 trillion is held in other indices. Overall, the latest data from the Investment Company Institute estimates that passive indices now constitute over 60% of the market, and is predominantly cap-weighted. This is increasing by as much as 4% per year. Thus, the majority of investment in the stock market is now just folks passively auto-buying broad market index funds, and most of these flows are from defined contribution retirement accounts like 401ks and IRAs.
Passive investing has grown significantly, rising from about 2% of total investments in the early 1990s. This shift has been driven by two things. First, the 2006 Pension Protection Act required 401ks to default employees into qualified default investment vehicles, which predominantly index the market. Second, the popularity of ETFs and the underperformance of many active managers has attracted a rapidly growing retail market. Anyone with an internet connection can compare the returns of a low cost index fund to more expensive active funds or a basket of stock picks and see it’s nearly impossible to beat the market long, so why waste your time?
The shift from pensions to a defined contribution retirement system in the US removed our collective ability to manage the needs of a large population based on actuarial (insurance) principles and created an incentive structure that pounds the buy button, leading to a massive, constant and largely passively indexed flow of cash into asset markets.
Now, what about our feedback loop problem? When a system reaches a threshold where it can’t sustain anymore signal, it introduces distortion, and if there’s any crosstalk between the input and output, it can result in a feedback loop. While it may seem silly to apply this theory to markets, it is the case that the market has a ceiling or limit to signal — it’s found in the bid ask spread on individual equities. For every buyer there must be a seller. For a large index fund from the likes of Vanguard or Blackrock that must mechanically clear buy orders when new money flows into their funds, it would be absurd to think that a lack of sellers wouldn’t drive up the bid until it finally becomes an offer that sellers can’t refuse. Conversely, in a situation where there is strong sell-side pressure, the indices must blindly copy that sell-side pressure.
Furthermore, even though indices and their resulting trackers seek to be proportional, the demand for the largest stocks is naturally higher, providing large companies tremendously advantaged access to capital through stock issuance and dilution.
Passive Structural Risk
In their 2024 paper, Passive Investing and Market Quality, Hofler, Schlag, & Schmeling show that an increase in passive ETF ownership leads to stronger and more persistent return reversals. They find that that more passive ownership causes higher bid-ask spreads, more exposure to aggregate liquidity shocks, more idiosyncratic volatility and higher tail risk.
They also found that the growth of passive investing makes price surges and rapid declines more extreme. Because passive funds must buy or sell shares to match the movement of an index regardless of a company’s actual health, they create a mechanical pressure on stock prices. When a market is rising, the mandatory buying from these funds can fuel a melt-up, pushing prices higher than they would go if investors were evaluating stocks individually.
Conversely, during a market downturn, the same mechanics apply in reverse. Passive funds are forced to sell as investors pull their money out, which can accelerate a sell-off. Because there are fewer active investors available to step in and buy stocks that have become undervalued, the downward momentum can become more intense. This creates a environment where market movements are amplified by the sheer volume of automated trading, potentially leading to greater overall instability.
So, zooming out, we don’t have to get overly technical to understand how the broad dynamics of investor participation in these passive flows might affect markets that are now “less elastic” systems. What about demographics?
As the boomer cohort moves into retirement, their shift from saving to spending means they will be selling off stocks to fund their lives. This creates a steady stream of selling pressure that could act like a slow leak for the market. While this happens gradually, a sudden energy shock combined with stagflation or a recession could turn that slow leak into a much bigger problem. If inflation stays high and the economy stalls, boomers might be forced to sell even more of their holdings just to cover rising costs.
In a scenario where the economy is shrinking but prices are rising, the usual safety nets don’t work as well. If the value of their portfolios drops during a recession, boomers might accelerate their selling to lock in what they have left. This mass exit could happen at a time when there aren’t enough younger buyers to pick up the slack, especially if those younger people are also struggling with high energy bills and a weak job market. A stagflationary environment would make it harder for the market to recover, as the constant selling from the boomer generation would constantly weigh down any potential rebounds.
This market is markedly different than any I’ve seen. As an armchair wannabe economist, I’m excited to see how it trades.