
There has been such an exhausting amount of media coverage recently surrounding an “AI bubble”, with widespread comparisons to the 2001 dot-com era, that you’d think the global economy was about to collapse any minute. Doom sells. Stop clicking. Analysts debate whether the current surge in AI investment is sustainable or if it reflects irrational exuberance, leading to fears of significant financial repercussions if the bubble bursts.
Have we seen this movie before?
- Boatloads of Investment
- Total global AI spending is projected to reach 1.5 trillion by the end of 2025. That’s more than the Manhattan Project and the Apollo program (the literal moonshot) and other major historic infrastructure projects combined — and yes, that’s adjusted for inflation.
- Over 1,300 AI startups have valuations exceeding $100 million, with 498 classified as “unicorns” (valued at $1 billion or more).
- Comparisons to Historical Bubbles
- Analysts love to compare the current AI boom to the dot-com bubble of the late 1990s, where speculative investments led to a market crash.
- Concerns arise from the significant rise in valuations of a few companies, reminiscent of the unsustainable growth and fiber-optic infrastructure overshoot seen during the dot-com era.
- Mixed Expert Opinions
- Doomers warn of irrational exuberance, suggesting that many AI investments may not yield expected returns.
- Optimists argue that the current landscape is fundamentally different, with substantial revenue generation and long-term contracts backing AI investments.
The boom has significantly boosted the market’s otherwise modest returns, with major tech companies like Nvidia and Microsoft reaching record valuations. Capital expenditures accounted for about 1.1% of U.S. GDP growth in the first half of 2025. Total U.S. GDP increased at an annual rate of 3.8% in the second quarter of 2025.
Tech companies are financing their AI infrastructure through equity, cash reserves and debt. In 2025, major firms like Oracle, Amazon, Google, and Meta have raised substantial $121 billion in debt, a sharp rise from previous years.

Let’s Concentrate
To quote fed chairman Powell’s mysterious double-speak, the market is “fairly richly valued”. Only ten companies account for about 42% of the S&P 500 index’s total market capitalization, surpassing previous peaks seen during the dot-com bubble. The performance of the index is heavily reliant on a small number of mega companies.
That’s a lot of concentration.
If these mega whales face downturns, the market will inevitably go down bigly. Despite concerns, periods of high concentration have historically been followed by strong market performance, but we’re several years into the megatrend. When we look back on prior bubbles, with the benefit of hindsight, there’s usually a fairly obvious point where the actors lost the plot. The forward multiples on several of these companies have already priced in highly ambitious earnings scenarios. The arithmetic facing analysts is challenging because the projections hinge on a speculative assumption: that AI deployed at scale will unleash exponential innovation. This potential also introduces a major risk of widespread labor displacement.
Perhaps the more abstract a given theme is, the longer a cult of speculative fervor can last. Do we recall the previous transformative silicon valley hype surrounding “big data” and VR? Once investors have suspended the necessity of fundamentals-based valuation, there’s nothing but narrative and momentum to anchor on, which is self-perpetuating. Technology has rewarded the faithful in the past. Given that such speculative manias have appeared throughout history, they can happen anytime, anywhere. To quote Cliff Asness, “never short a cult.” He offers a reasonable theory — if algorithmic media has increased confirmation bias, echo chambers, political polarization and conspiracism — why wouldn’t the same phenomenon manifest in markets that have seen a substantial increase in consumer retail inflows?
The street will only pile in on FOMO and good vibes for so long. Smart money wants to see evidence of revenue, not to mention that analysts are tiring of the blue sky narratives from the likes of OpenAI who can’t be bothered with outlining a profitable business plan for a world-changing technology (lest we forget that a young Facebook and Google didn’t either). But investors read and talk to independent energy analysts.
As Paul Kedrosky explained it on the Bloomberg Odd Lots podcast, the incentive seems to be for all players to grow the top line as much as possible, even if adding more users just leads to greater and greater losses. Models have negative unit economics, which is a fancy way of saying that every sale loses money but maybe we‘ll make it up in volume? 🤷 AI is NOT like traditional cloud software — there is no marginal-cost magic going on. Cost increases linearly with each user. The faster that frontier chips innovate, the more capex investment and energy is required to keep up. AI data centers require unprecedented amounts of energy and advanced water-based cooling systems. This is a far cry from the early data centers built by Google and Amazon. In the mid-2000s, Google was creatively stacking modular cargo containers with DIY low-cost commodity motherboards, ram, hard drives and cat 5 cables to keep up with the early explosion of “the cloud.”
The big players on Wall Street have been hedging in a market where there aren’t a lot of good options. Everything is overvalued.
A History Of Whales
By definition, the cap weighted total stock market indices have always featured big whales. Buy and hold investors appreciate the “self cleansing” nature of broad market index funds. Up and coming companies rise up the ranks and take the place of fading companies without the need to trade in or out of individual stocks, incur taxes or time the market. This “skewness” drives reliable long-term returns. But that doesn’t mean periods of rotation aren’t painful. What to do?
Historic Concentration:
- 1980: 26%
- 2000: 29%
- 2021: 33%
- 2025: 42%
Echoes of The “Nifty Fifty”
It doesn’t take a PhD in finance to see the boom-bust cycles in stock markets. Do we need any other reason to question the “Efficient Market Hypothesis?” If stock markets drop 20-40% without a recession, how is that efficient? We can reassure ourselves with terms like “leading and lagging indicators.” We like the dot-com comparison, but let’s rewind back even further to the lesser known Nifty Fifty bust.
The Nifty Fifty era during the late 1960s to early 1970s saw investors, particularly institutions, fixate on about fifty blue-chip stocks like Coca-Cola and IBM, believing them to be “one-decision” investments. Just buy and never sell regardless of price. This cult of quality inflated their Price-to-Earnings (P/E) ratios to unsustainable highs (often 50x or more), as fundamental valuation was ignored in favor of guaranteed growth. This glorious delusion of paper gains came crashing down in the 1973–74 market crash, triggered by high inflation, rising interest rates, and the oil embargo. The broad market fell 45%, but Nifty Fifty stocks, having been most overpriced, suffered the deepest wounds (e.g., Polaroid dropping over 90%), proving that even great companies at outrageous prices lead to devastating losses.
Following the Nifty Fifty debacle, Nobel laureate economist Paul Samuelson recognized the inherent foolishness of this behavior and famously called for a simple solution in a 1974 column for Institutional Investor. He declared, “A proper capital-market theory implies that the maximum return for a given level of risk is earned by holding the market as a whole.” He then challenged the financial community to create a low-cost alternative for investors, stating: “A major step forward will have been taken the day somebody simply sets up a trust to buy a fixed fraction of all the listed stocks in the efficient, diversified total stock market, thereby creating a genuine microcosm of the market.” This proclamation directly led to the conceptual foundation of the first S&P 500 index fund, which would allow investors to sidestep speculative bubbles and achieve market returns simply and cheaply.
Top 10 Companies by Decade
Let’s look back at the top ten stocks at the start of each decade over the past 55 years.
1970
- IBM
- AT&T
- Eastman Kodak
- GM
- Texaco
- GE
- Exxon
- Dupont
- Chevron
- Sears
1980
- IBM
- AT&T
- Mobil
- Texaco
- Exxon
- Schlumberger
- Amoco
- Eastman Kodak
- GM
- DuPont
1990
- IBM
- Merck
- Exxon
- Bristol-Myers Squibb
- GE
- Mobil
- AT&T
- Chevron
- Philip Morris
- Procter & Gamble
2000
- Microsoft
- Walmart
- GE
- Lucent
- Cisco
- IBM
- Exxon/Mobil
- AOL
- Intel
- Citigroup
2010
- Exxon/Mobil
- Berkshire Hathaway
- Microsoft
- Apple
- Walmart
- JP Morgan Chase
- Procter & Gamble
- GE
- Johnson & Johnson
2020
- Apple
- Microsoft
- Alphabet
- Amazon
- Berkshire Hathaway
- JPMorgan Chase
- Johnson & Johnson
- Visa
- Procter & Gamble
2025
- Nvidia
- Microsoft
- Apple
- Amazon
- Alphabet
- Meta
- Broadcom
- Berkshire Hathaway
- Tesla
- JPMorgan Chase

Beyond The Whales: Mid Cap Companies
Small & Mid Size Companies Win Long
Factor investors have been arguing for years whether the “size” premium still exists. For those who’ve been betting on basic market weight or primitive price to book value screens that you get from a .07 bips ETF or index, there’s been a lot of apologizing over the past decade about why it so badly underperformed the market. However, when we control for quality; Voila! It magically reappears
When we go down the quantitative rabbit hole, it’s easy to lose sight of good ol’ common sense. Why wouldn’t it just be cyclical like everything else? Big companies become oversold in bull markets, the hungry underdogs come back in bear markets. While the biggest names in technology have seen handsome returns over the past fifteen years, mid and small cap stocks have historically shown stronger performance compared to their large-cap counterparts over extended periods. Mid-cap stocks are an oft-overlooked “sweet spot”. The S&P MidCap 400 delivered a total return of 985% over 25 years, compared to 563% for the S&P 500.
As Paul Samuelson noted, usually, a broad market fund is considered an optimal indexing strategy. If you hang out on the BogleHeads forums, you may be ridiculed for wasting your time with anything but buying and holding a total stock market index fund. While obviously dogmatic, there are strong pragmatic reasons for this perspective for an everyday investor:
- The byproduct of dynamically cap-weighting a wide sample of stocks is that you can be sure that more of your investment is in best performing companies over time.
- The CRSP total US stock market index fund holds 3,533 stocks. Think that’s enough diversification? The smallest holdings must have a loooooong string of leading zeros. One imagines the entire Vanguard collective AUM holds like one share of that company at the bottom. They should put the certificate in a glass display case in the lobby as proof of fund completeness.
- The market represents a kind of “super-intelligence” or hive mind that (reasonably) efficiently aggregates all of the latest information into optimal selection via price discovery.
- Historically, the majority of businesses traded in the market generate profits and thus appreciate in value. Failing companies gradually fade.
- The oft-cited disclaimer that past performance is not indicative of future returns is especially true of any strategy that deviates from the market average. While factor premia like size, value, momentum, and profitability have been observed in historical data via tests of statistical significance, investors don’t know when they will appear, how long they’ll last, or the risk-adjusted returns they’ll deliver.
It’s hard for any professional investor to argue against the relative effectiveness of a simple low-cost broad market long-term indexing strategy, especially when combined with other asset classes in a portfolio. That said, just because we “don’t have a crystal ball” doesn’t mean that we can’t stand back, squint our eyes and see big obvious long term trends to better trade in this market.

Why Would Smaller Companies Outperform?
It’s early. We don’t know nothin’. Let’s consider a non-quantitative narrative.
If AI proves as transformative as many expect, there’s the next wave of innovators. History shows that breakthroughs often emerge from the ground up rather than the established elite. The railroad began as a disruptive force that enabled small towns to flourish and new businesses to rise, reshaping commerce and transportation far beyond the vision of its original financiers. The internet followed a similar path, with early pioneers building tools in garages and dorm rooms that later redefined communication, retail, and entertainment.
AI could spark comparable upheaval, radically altering manufacturing through autonomous production lines, health care through predictive diagnostics, genetic engineering through rapid R&D and financial and legal services through intelligent automation. Just as railroads connected distant markets and the internet connected global communities, AI may connect knowledge and decision-making in ways that empower innovators far outside today’s centers of power.
Tech whales are thus subsidizing the base cost of future research, development, innovation and disruption for other market sectors. They are transforming compute into a low margin commodity. Models will be free. The next generation of small innovators will harness this in ways we can’t yet imagine. A good reason to be bullish on the U.S.A. is not just the usual platitudes of democracy, capitalism and a culture of risk taking, but a strong and reasonable legal system that makes it possible. Think of how much “good guy” compute will be required to combat “bad guy” compute to police and enforce the future of things we take for granted, like identity and intellectual property.
As we’ll see in the series of charts below, the relative performance of large, mid and small cap stocks has rotated and “changed” leading positions over time, even when quality screens are excluded.
Mid cap companies have outperformed long term because they’ve exhibited a few interesting characteristics:
- Mid-caps contain the next innovative businesses with ample growth potential.
- Mid-cap firms are typically more agile and can adapt better to changing economic conditions.
- A shift in market focus towards mid-cap stocks occurs as investors seek diversification away from a concentrated large-cap market that has exhausted already priced in forward growth potential.
- Mid caps see more competitive valuations. The small and mid cap space is brutally competitive.
- Mid caps exhibit bursts of rapid recovery following market drawdowns
- They otherwise have strong correlation (beta) with the broad market average returns, meaning that they tend to keep pace with the total market.
Size factor exposure, such as an allocation to a mid-cap index fund like Vanguard’s VIMAX is usually a long-term commitment. An investor must be willing to weather periods of underperforming the market. Missing transient rallies can significantly reduce the premium potential. However, if you’re interested in risking timing the market, tilting a portfolio during periods of glaring hyper-concentration might be worth the gamble. Read the legendary Cliff Asness’ takes here and here prior to proceeding with caution.
Tilts and Over-weighting in Index Investing
Index investing is essentially a statistical approach. Folks with backgrounds in research, engineering and finance often prefer it given the tremendous range of products available today. A core principle is that a given index represents a large enough sample size to capture whatever factor or attribute you’re trying to target in a broad population of companies. Most “pure” index investors hold the best representation of the market possible, such as the CRSP Total US Market index as the “core” position in their portfolio and “tilt” to factors using any number of specialty funds. The S&P 500 only covers approximately 80% of US companies, but because it is weighted by market cap, and 500 is a very large sample size, it closely approximates the returns of the entire US market. Most of the time, the returns are about the same.
The problem with tilting is that combining indexes results in an unpredictable overweighting of certain companies at certain times. For example, a total market index will hold every possible company in the US market. Compared to the S&P 500, it already has less exposure to large and mega caps to start with. Combining it with a mid cap or small cap weighted index will cause “lumps” in your cap weight distribution. This is of course the point — but the indexes we chose to combine can be more or less precise. For example, there is zero overlap between the S&P500 set and the S&P400 Mid Cap set, but there’s significant overlap between the S&P500 and the CRSP U.S. Mid Cap Index, because Standard & Poors and the Center for Research in Security Prices (CRSP) at the University of Chicago use different methodologies.
A mid-cap stock market cap is generally between $2 billion and $10 billion. When it comes to classifying companies into small medium and large companies, the definitions and demarcation points can differ substantially between the major indexing firms.
There four different mid-cap indexes are:
- CRSP U.S. Mid Cap – around 350 companies with an average 19B market cap
- S&P MidCap 400 – around 400 companies with an average 6B market cap
- Russell Midcap – 824 companies with an average 24B market cap
- Dow Jones U.S. Mid-Cap – around 500 companies with an average 9B market cap
As you can see, the range of what is considered “mid-sized” varies. With the S&P, you’re deep into what Chicago would consider the small cap range. Chicago provides significant exposure to the lower half of the S&P500 large cap without veering into mega caps.
So, if you’re planning to tilt, consider staying within the same indexing family. For example, Vanguard and Dimensional Fund Advisors prefer a special arrangement with CRSP, but Vanguard also offers the S&P trackers in an ETF wrapper with a slightly higher expense ratio to license S&P’s proprietary indices. Most other firms prefer S&P, Russell and MSCI.

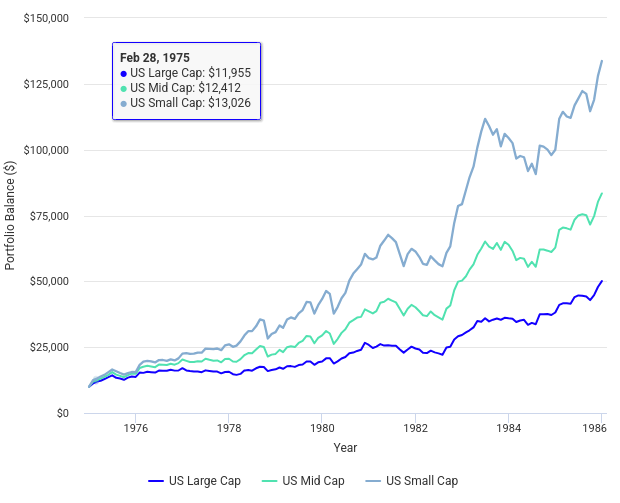
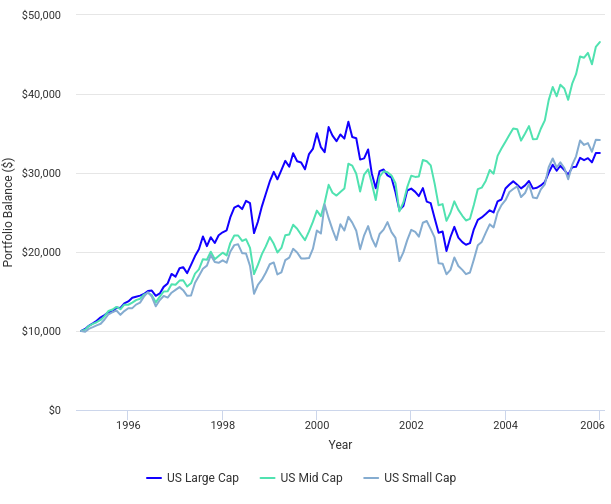
Chart Time: Historic Large, Mid & Small Performance
We love charts. Let’s take a look at historic ten year performance incremented in five year intervals. Graphs are courtesy of Portfolio Visualizer.
Historical Index Market Data:
- US Large Cap – S&P 500
- US Mid Cap – S&P MidCap 400
- US Small Cap – S&P SmallCap 600
1975-1985: Small Cap Dominance
1980-1990
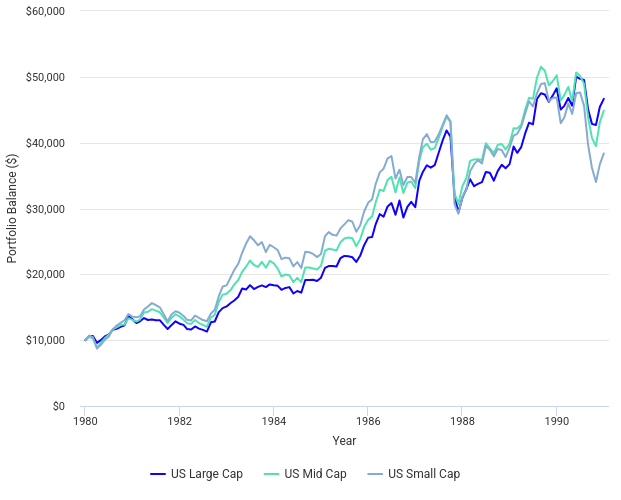
1985-1995
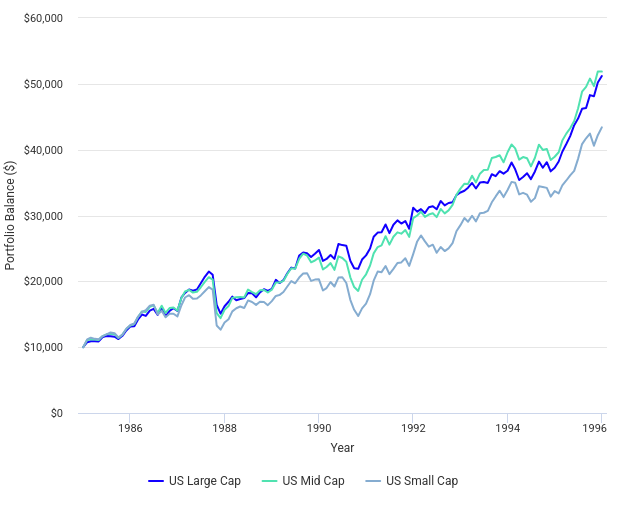
1990-2000: The New Economy
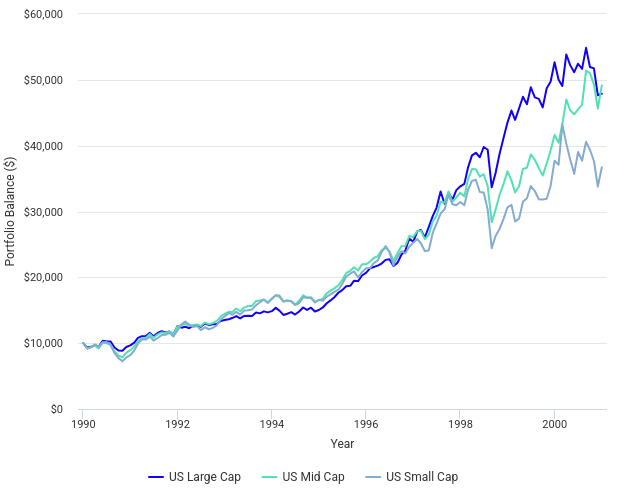
1995-2005: The Dot Com Bubble Pops
2000-2010: The Lost Decade
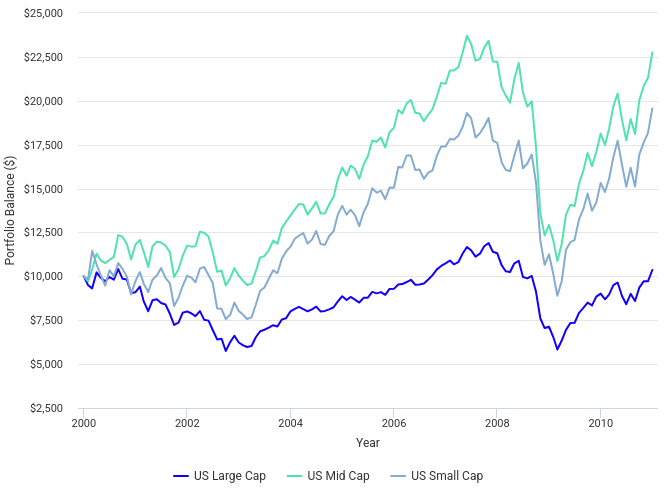
2005-2015: The GFC Rebound

2010-2020: The Great Bull Market

2015-2025: The Global Pandemic & The Rise of the Mega-Caps

Combined Performance Across 1990-2025: The Modern Tech Era

Annual Returns

Mid-caps are often overlooked, especially during periods of large cap growth and performance. Mid caps carry slightly higher volatility risk, and while their high beta means their drawdowns may be significant, they may offer the potential for higher returns and rapid rebounding behavior. However, if these charts offer any insight, it’s that each period was a distinct set of economic conditions that may never rhyme nor repeat. Past performance is no guarantee of future returns.