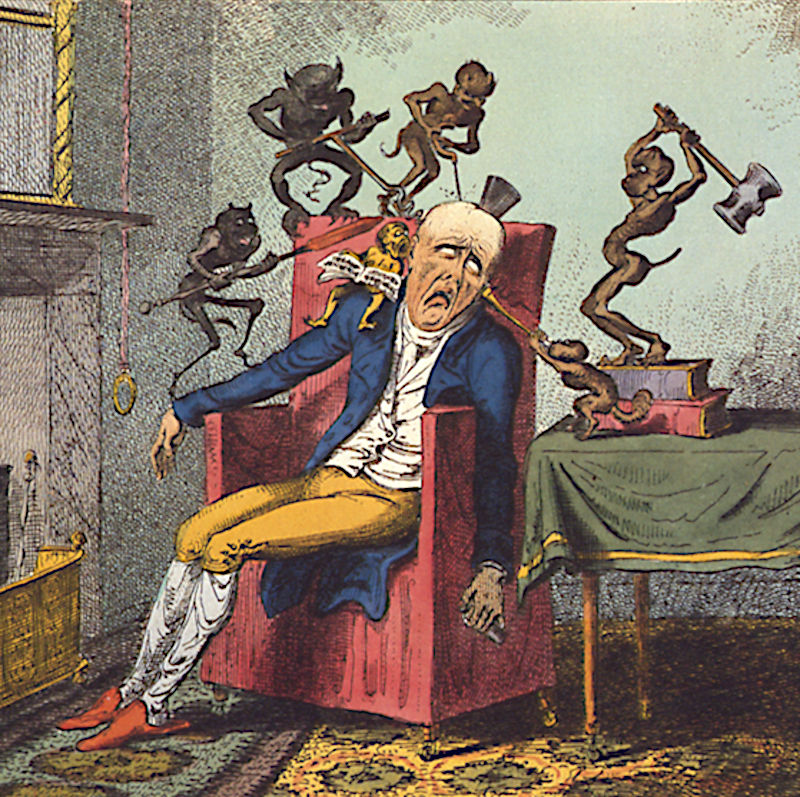
There is something almost ritualistic in the way we now speak of the national debt, as if it were some ancient curse, a demon conjured by the reckless spending of our ancestors, now come to claim its due. Politicians and pundits recite the incantations: $40 trillion in unpaid debt, a debt-to-GDP ratio exceeding 120% for the first time since the Second World War. And the interest? A mere $1 trillion a year—a sum so vast it has become abstract, like the weight of a mountain measured in grains of sand.
For decades, economists assured us that this burden was not only bearable but even optimal—that the United States, with its unparalleled dominance of global finance, could carry such a load indefinitely. Now, even those who once sang its praises whisper of a threshold crossed, a point of no return. The fear is not merely that the debt will grow, but that the interest payments will outpace the economy itself, dragging the nation into a spiral of decline from which there is no escape. A debt so vast it devours its own tail.
And yet history, that most unreliable of oracles, offers a counter-narrative. After the Second World War, the United States carried a debt burden just as staggering, if not more so. By 1946, the debt-to-GDP ratio stood at over 120%, and yet, within a decade, it was nearly halved. How? Not through austerity, not through the stern discipline of penury, but through a combination of explosive growth, taxation, and deliberate inflation.
The post-war boom was not some inevitable triumph of free-market logic. The economists of the time had predicted catastrophe. Paul Samuelson and Alvin Hansen—men who shaped generations of economic thought—warned that the end of the war would bring not prosperity, but ruin. The war machine, they argued, had propped up the economy through sheer force of expenditure. Remove that prop, and the whole edifice would collapse into depression.
They were wrong.
And why? Because they had misunderstood that the war economy was not, in fact, a self-sustaining machine. It was a vast, inefficient engine of destruction rather than creation, where every shell fired, every ship launched, every bomb dropped, won the war but was otherwise an economic dead end. The real wealth of nations is not built in the foundries of war, but in the accumulation of human skill, in the bridges that connect communities, in the factories that turn raw materials into things people actually want to buy.
And then there were the savings.
For years, ordinary Americans had been forced to save. Rationing, price controls, the sheer unavailability of consumer goods meant that wages, however meager, piled up in bank accounts and war bonds. By 1945, American households had accumulated a financial cushion unprecedented in history. When the war ended, the factories that had churned out tanks and rifles did not lie idle. They turned instead to refrigerators and automobiles, to the very things that a population starved of consumption for years now desperately wanted.
The Marshall Plan did not just rebuild Europe, it rebuilt markets for American goods. The Cold War did not merely divide the world into spheres of influence, it ensured that American capitalism would have no rival. And the welfare state, far from being a burden, was an investment — a way to stabilize demand and ensure that the workers of Detroit and Pittsburgh could afford the cars they built.
We speak now of debt as if it were a moral failing, a sin to be atoned for through suffering. But debt is not a force of nature. It is a human invention, a tool of power. The question is not how to pay it, but who benefits from its existence. The post-war boom was not just a miracle of citizens’ prior thrift. It was a moment when the U.S. decided that the best way forward was not through austerity, but through expansion and the vision of a world where even the poorest could dream of owning a home, where the working class could buy the products of their own labor.
The U.S. post-war debt was halved via a combination of four factors.
The first factor was growth. Not the anemic, debt-fueled expansion we see today, where every uptick in GDP is purchased with yet more credit, but a real growth driven by a workforce swollen by the baby boom, by women entering the labor force in unprecedented numbers, by a world hungry for American goods. The economy expanded not because of some mystical faith in free markets, but because the state chose to invest in its people. Factories that had once produced tanks now churned out refrigerators. Highways stretched across the continent. The middle class, that great American invention, was not a natural phenomenon but a deliberate construction.
The second factor was the management of inflation. The Federal Reserve kept interest rates artificially low, allowing the government to borrow at rates below the pace of economic growth. The real cost of debt, in other words, was negative. The government could borrow a dollar today and repay it for less in real terms. It was, in effect, a default. And yet, the markets, starved of alternatives, accepted this arrangement of financial repression without protest.
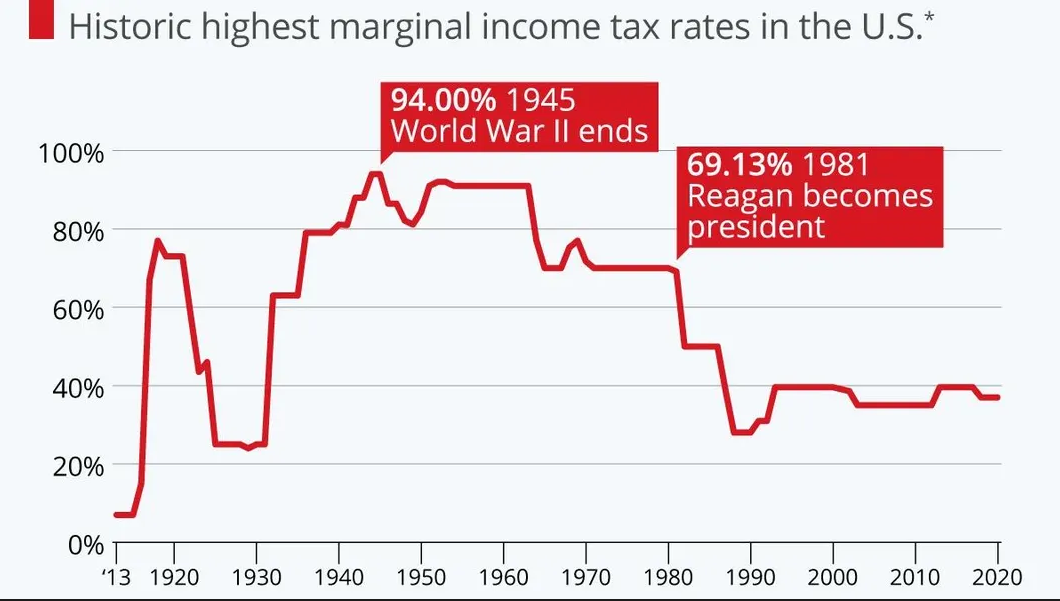
The third factor was taxation. After a short period of tax reduction immediately following the postwar recovery, the Revenue Act of 1950 raised lowest rate from 16.6% to 20%, and the top rate from 82.1% to 91%. Today it’s 37%. The top corporate tax rate was raised from 38% to 45% and a 30% surcharge was levied on excess business profits, meaning that some corporations faced a marginal rate of 77%. Today it’s 21%. Social Security tax rates in the 1950s were between 1.5% and 2.25% on a low wage base, with no Medicare tax (enacted in 1965). Today, the combined FICA payroll tax is 15.3% (split between employer and employee) up to the taxable maximum, plus additional Medicare surtaxes on high earners.
The fourth factor was the monopoly on global finance. Under Bretton Woods, the world had little choice but to hold dollars, to accept their value as dictated by Washington. Today, the dollar still reigns, but its throne is shakier. The world has options now. China, Europe, even the petrostates of the Middle East, can—and do—demand better terms.
The Theater of Debt and the Spectacle of Power
The tragedy of modern America is not that the debt is not the result of some inevitable economic law, but of deliberate political choices. The Reagan tax cuts, the Bush tax cuts, the wars in Iraq and Afghanistan, the bailouts of 2008, the Trump tax cuts after a massive pandemic, the tariffs, the conflict with Iran—each of these was not an act of fiscal necessity, but of political calculation. Deficits, after all, are not a bug in the system. They are a feature. They are how you win elections.
The post-war boom was achieved through strategic spending—through investments in high multiple programs that drove the economy forward. Today, budgets are based on what is politically possible while also maintaining low taxes. It is performative. It is a kind of theater, a spectacle designed to keep the machinery of politics running, even as the economy rots beneath it.
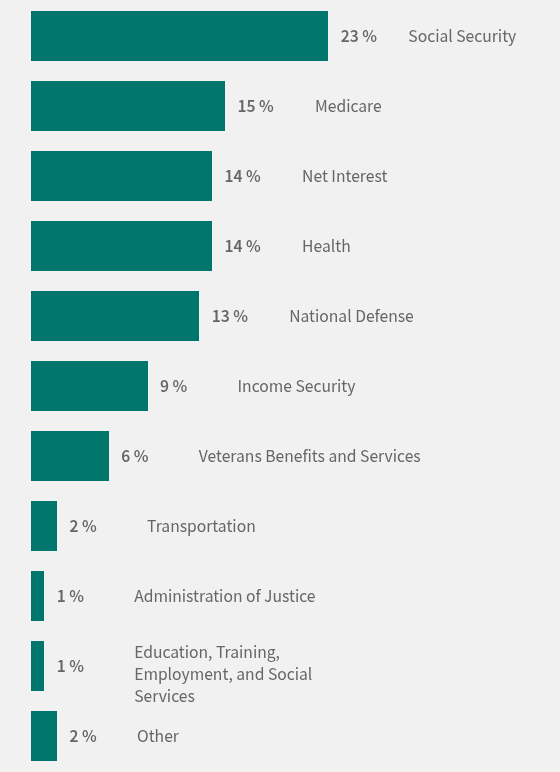
And then there are the entitlements—the sacred cows of American politics. Social Security, Medicare—programs that were never designed for a world where people live into their 80s, where families have one child instead of four, where the very idea of retirement has been transformed from a brief respite into a decades-long odyssey. The Baby Boomers, that most powerful of generations, have wielded their political clout to ensure that these programs remain untouchable, even as the arithmetic of demography makes their continuation impossible.
The result? A dependency ratio that has nearly doubled since the 1960s and a political class that has no answer but to kick the can down the road. The post-war average deficit of 1.1% of GDP is now projected to balloon to 7.5%—a figure that would have sent economists of an earlier era into paroxysms of despair. And yet, we accept it as inevitable, as if the laws of economics were written in stone rather than ink.
But here is the irony: the very idea that debt-to-GDP ratios above 90% spell doom for an economy is itself a myth—a myth that was once thought to be backed by the authority of science, even though Japan passed that rubicon in the late 90s and now stands at over 200%. Published in 2010 by Harvard economists Carmen Reinhart and Kenneth Rogoff, the paper “Growth in a Time of Debt” argued that national debt-to-GDP ratios exceeding 90 percent severely depress economic growth. Pro-austerity policymakers worldwide seized upon this 90 percent threshold to justify sweeping government spending cuts. It had been used as the foundational text of austerity until a 27 year old graduate student named Thomas Herndon decided to replicate the study. When his results didn’t match, he emailed the authors and, after some back-and-forth, received their spreadsheet. It turned out that a simple Excel error had excluded five countries (Australia, Austria, Belgium, Canada, and Denmark) from the dataset.
When Herndon corrected the errors and included the missing data, the conclusion flipped. Countries with debt-to-GDP ratios above 90% didn’t suffer the minus 0.1% growth claimed by the original study, instead, they grew at about 2.2%, slightly slower than less indebted nations but still positive (and around the growth rate of the U.S. economy in 2026). While this may seem like a small difference, it’s massive when used to justify austerity during recessions.
And yet, even after the myth was exposed, the damage was done. The austerity measures imposed on Greece, Spain, and the United Kingdom after the 2008 financial crisis did not reduce debt. They shrunk economies, they increased unemployment, they turned recessions into depressions. The debt-to-GDP ratio did not fall. It rose.
So when did the U.S. fiscal trajectory begin to diverge from its postwar path? Like most historical shifts, it wasn’t a single rupture but a long series of policy choices that nudged the system toward a new normal. The postwar decades, for all their contradictions, had at least one defining feature: a shared assumption that government had a role to play in shaping the economy, not just balancing its books.
Laffing all the way to the bank
The year is 2012. The global economy is still reeling from the fallout of the 2008 financial crisis. The U.S. had seen 8.8 million jobs lost. The unemployment rate had gradually recovered to around 8% after a period where nearly one in ten people were out of work. The total direct cost of bailouts was about $500 billion, or 3.5% of GDP in 2009. Congress is locked in a heated legislative battle over whether to let the Bush-era tax cuts for high-income earners expire. The Congressional Research Service (CRS) tasked Thomas L. Hungerford with examining how tax cuts impact the economy. The findings were published in the report “Taxes and the Economy: An Economic Analysis of the Top Tax Rates Since 1945.”
The report’s release immediately thrust a typically low-profile, nonpartisan research institute into the center of a partisan war. Published just two months before the 2012 U.S. presidential election, the study became central to the debate over the impending expiration of the Bush-era tax cuts. Democrats seized on its conclusions: cutting top tax rates did not spur overall GDP growth but instead widened income inequality. It provided empirical support for President Barack Obama’s proposal to raise marginal tax rates on high earners. Major media outlets framed it as a direct refutation of supply-side economics, sparking immediate alarm among conservative lawmakers.
The political clash reached its peak in late October 2012, when Republican senators lodged fierce objections to the report. Conservative economists, think tanks, and leading lawmakers criticized Hungerford’s methodology. Under intense congressional pressure, the CRS took the extraordinary step of withdrawing the report on November 1, 2012, just five days before Election Day. The move triggered a second wave of political outrage, this time from Democrats, who accused Republicans of censoring objective economic research. High-ranking Democrats condemned the decision, publicly comparing the suppression of an independent research document due to political disagreement to the tactics of a “banana republic.”
Evaluated through the lens of modern quantitative macroeconomics, the core thesis of Hungerford’s study was fundamentally correct. A vast body of empirical research both before and after the report now corroborates his main finding: tax cuts for upper-income earners and corporations are inefficient growth mechanisms compared to targeted relief for low-income households or productive public investments.
A seminal study by Christina Romer and David Romer in 2010 used a narrative identification strategy to isolate tax shocks from cyclical fluctuations; while they found that broad-based tax hikes harmed economic output, subsequent analysis by economists like Owen Zidar in 2019 revealed that this output response was entirely driven by tax cuts targeting low and middle-income workers. Zidar’s research confirmed that tax cuts for the top 10% have a near-zero and statistically insignificant effect on employment and overall GDP. Similarly, a 50-year panel study of 18 OECD countries by David Hope and Julian Limberg in 2022 found that major tax cuts for the rich systematically increased the income share of the top 1% without generating any measurable boost to real GDP per capita or employment rates.
Ultimately, Hungerford’s conclusions reflected an emerging consensus within academic public finance. While tax cuts for high earners are often sold as a way to unleash investment and prosperity, empirical data consistently show that their primary outcome is the redistribution of national income upward, with no significant alteration to overall economic growth.
This marked a turning point in policy orthodoxy since the late 1970s. During that decade’s stagflation crisis, the famous “Laffer Curve” sketch provided the intellectual architecture for supply-side, “trickle down” economics, arguing that marginal tax rates were so high they actively discouraged work and capital formation, which was true at the rates of that era. This framework justified the Reagan administration’s massive tax cuts and deregulation, launching a decades-long legislative experiment based on the assumption that lightening the tax burden on businesses and high earners would trigger widespread growth. The problem was subsequent administrations assumed that more cuts would have a similar effect, and that all cuts would be good.
Conservative economist Arthur Laffer himself has stated that he did not invent the concept, pointing to antecedents such as the 14th-century Islamic scholar Ibn Khaldun’s Muqaddimah, John Maynard Keynes, and Adam Smith. Even Andrew Mellon, Secretary of the Treasury from 1921 to 1932, articulated a similar policy idea in 1924. Nonetheless, Laffer’s name became synonymous with the curve after a 1978 National Affairs article that recounted a 1974 dinner meeting at the Two Continents Restaurant in the Washington Hotel, where Laffer, Arthur Burns, Dick Cheney, Donald Rumsfeld, and Grace-Marie Arnett discussed President Gerald Ford’s proposed tax increase. According to article, Laffer sketched the curve on a napkin to illustrate his point: beyond a certain tax rate, revenue would decline because economic activity would be discouraged. Cheney reportedly did not accept the idea immediately, but it resonated with the others. Laffer has since professed no memory of the napkin incident but acknowledged, “I used the so-called Laffer Curve all the time in my classes and with anyone else who would listen to me.”
It’s obvious that tax revenue will be zero at 0% and 100% rates, which means that revenue must peak somewhere between these extremes. But where? Studies consistently show that modern developed economies now operate well below the revenue-maximizing tax rate. Estimates suggest the peak of the curve occurs at overall tax rates between 60% and 80% (pre Reagan-era tax rates), depending on tax structures and labor elasticity. Thus, while the theory correctly describes extreme tax boundaries, empirical evidence does not support the claim that broad tax cuts will generate enough growth to fully offset revenue losses. In 2018 Arthur Laffer and Stephen Moore lauded the 2017 Tax Cuts and Jobs Act. Conservative Harvard economist Greg Mankiw subsequently characterized Laffer and Moore’s work as “partisan and not based on the foundation of professional consensus or serious studies from peer-reviewed journals.”
Since Reagan’s landmark Economic Recovery Tax Act of 1981, which slashed top marginal rates from 70% to 50% and introduced accelerated depreciation, major U.S. tax cuts have followed a cyclical pattern of deficit-financed reductions. The Tax Reform Act of 1986, though revenue-neutral in design, dramatically lowered top rates to 28% while broadening the base. George H.W. Bush’s 1990 budget deal partially reversed this trend with modest rate increases, but Bill Clinton’s 1993 Omnibus Budget Reconciliation Act raised the top rate to 39.6% before the 1997 Taxpayer Relief Act introduced capital gains cuts and estate tax exemptions. George W. Bush’s 2001 and 2003 tax cuts included phased reductions in marginal rates, the elimination of the estate tax, and dividend/capital gains relief. They were later extended under Obama in 2010. The 2017 Tax Cuts and Jobs Act (TCJA) permanently slashed the top corporate rate from 35% to 21%, repealed the corporate AMT, and introduced a 20% deduction for eligible pass-through businesses. For individuals, it temporarily lowered marginal rates, nearly doubled the standard deduction, expanded the Child Tax Credit and estate tax exemptions, and capped state and local tax deductions at $10,000 while lowering the mortgage interest deduction threshold. The law also reduced the Affordable Care Act’s individual mandate penalty to zero, eliminating incentives to participate. Biden’s 2022 Inflation Reduction Act focused on green energy incentives and corporate minimum taxes rather than broad rate cuts. Each of these reforms reflected shifting economic priorities, from supply-side stimulus to deficit reduction, with mixed long-term effects on growth and revenue.
Following the massive pandemic-era expenditures—including the CARES Act (2020), the Consolidated Appropriations Act (2021), and the American Rescue Plan (2021), current U.S. tax rates remain structurally lower than pre-pandemic levels, despite temporary expansions of credits like the Child Tax Credit. The top individual rate stands at 37%, the corporate rate at 21%, and capital gains taxes at 20% for high earners, with no broad-based rate increases enacted to offset pandemic-era deficits. In contrast, post-World War II tax policy under Truman and Eisenhower prioritized debt reduction, capital market stability, and inflation control through higher marginal rates. The Revenue Act of 1942 raised the top individual rate to 88%, and the 1950s maintained rates above a staggering 90% to fund wartime debt and curb inflation.
Today, however, the fiscal landscape looks different. Net interest payments on the U.S. national debt reached a record $1.05 trillion for fiscal year 2026, with an overall average rate on interest-bearing federal debt of approximately 3.53%. Meanwhile, the annual headline inflation rate in the United States stands at 3.7% for the 12-month period ending in September 2026. GDP growth over the past two years of the so-called “AI Boom” has been merely average.
Over the long term, the structural outcomes of the U.S.’s low-tax, deregulatory regimes diverged sharply from the predictions of supply-side economics. Instead of unleashing self-financing growth that would lift wages across sectors, this policy mix coincided with a deepening of income and wealth inequality, stagnation in real median wages, and a decoupling of productivity from compensation. At the same time, freed from strict financial and industrial constraints, capital increasingly flowed into asset markets rather than productive fixed-capital investments. This dynamic fueled a prolonged appreciation in asset prices like real estate and equities, benefiting capital holders while maintaining a highly unequal concentration of wealth. Meanwhile, macroeconomic shocks and monetary adjustments interacted with these inequality vectors, setting the stage for a renewed examination of how governments allocate capital.
Shifting away from the limitations of supply-side tax and deregulation frameworks, let’s turn our attention to government spending. While decades of conservative policy emphasized shrinking the public footprint and lowering tax obligations for high earners, modern analysis has more sophisticated models. Understanding why tax cuts for high earners fail to stimulate broad-based economic growth naturally leads to examining what economists call the multiplier effect, assessing how direct public spending circulates through the national economy to generate real and high economic returns.
Go Forth & Multiply
There’s a common refrain among conservative politicians that their more liberal colleagues are fiscally reckless because they “tax and spend,” suggesting government budgets depend on tax revenue from the private sector before any spending can occur. Otherwise, deficits would result. To the average person balancing a business ledger or family budget, this logic seems sound. Yet the reality is the opposite: the sovereign government is the source of money issuance while taxation and bonds are the primary means of money reclamation. Non-intuitively, well-targeted government spending generates higher tax receipts in the same way that a good business returns a profit. This is called the multiplier effect. It occurs when government expenditures create income for recipients, such as builders, teachers or nurses, who then spend and reinvest that money, triggering multiple rounds of economic activity. The multiplier quantifies the total income generated from an initial injection of spending. For example, if $100 in government spending leads to $200 in total income, the multiplier is 2. Some forms of spending, like Medicare, produce strong multiplier effects, while others, such as defense, yield far smaller returns.
The effectiveness of the multiplier can be weakened by factors like savings or spending on imports. If the economy is already operating at full capacity with a tight labor market, excessive spending fuels inflation rather than sustainable growth. Many policymakers, however, still view government spending primarily as a cost rather than an investment. They overlook that spending cuts can reduce income and tax revenues, making austerity measures counterproductive. A 2025 study by economists Tom Krebs and Patrick Kaczmarczyk at the University of Mannheim examined the macroeconomic impact of rising defense budgets in Germany. Their research found that military spending carries a relatively low fiscal multiplier of around 0.5, due to factors like heavy reliance on imported defense equipment, weak domestic supply chains for high-tech military goods, and limited long-term productivity gains from such investments.
In contrast, public investments in areas like healthcare, education and infrastructure deliver strong economic returns. Spending on human capital, particularly early childhood education and public schooling, can yield multipliers between 2.5 and 3.5 over the medium to long term. These investments remove barriers to workforce participation, enhance future productivity, and have minimal import leakage, ensuring most benefits circulate domestically. Similarly, infrastructure projects in transportation, energy, and digital networks produce multipliers ranging from 1.5 to 2.5 by reducing business costs, attracting private investment, and strengthening regional competitiveness. Routine government operations and transfer payments, such as public sector salaries or unemployment benefits, offer more modest multipliers between 0.8 and 1.2, as much of this spending flows into imported goods or services.
Ultimately, the fiscal multiplier, defined as the ratio of national income change to government spending change, demonstrates that not all public expenditures are created equal. The hierarchy of multipliers reflects how efficiently different types of spending circulate domestically and contribute to long-term economic growth.
Thus, what if the real fiscal myth isn’t that governments spend too much, but that they spend in the wrong places? The prevailing narrative rooted in the idea that tax cuts for the wealthy and corporations will trickle down to benefit everyone has dominated economic policy for decades, yet the evidence simply doesn’t support it. The United States now faces a dual challenge: a growing national debt service and persistent underemployment, particularly in sectors that could drive long-term prosperity. The solution isn’t austerity or indiscriminate spending cuts, but a strategic reallocation of resources toward investments with the highest economic returns. By focusing on areas where the multiplier effect is strongest, like infrastructure, healthcare, child care and education, governments could reduce debt over time while fostering job creation, productivity growth, and economic resilience.
Economic growth strategies focused on expanding the middle class aims to strengthen the purchasing power of middle- and low-income households while requiring businesses and high-income earners to contribute more to reducing the budget deficit. These proposals combine targeted public investments to boost productivity and long-term economic resilience with the stabilization of public finances.
The central fiscal mechanism relies on tax reform, including higher corporate tax rates, combating tax evasion, increasing marginal tax rates on high incomes, and introducing taxes on capital gains and consumption by holders of large fortunes. To address structural long-term debt issues and ensure the sustainability of social security funds, progressive reform advocates propose raising the income cap subject to payroll taxes and applying this tax proportionally to all income above the current threshold. The introduction of a carbon tax is also supported, as it would generate sustainable revenue while reducing debt without compressing the incomes of the working class.
To reconcile deficit reduction with economic growth, this strategy prioritizes public investments in human capital, clean energy, and national infrastructure. Expanding childcare subsidies, funding public education, and supporting vocational training improve workforce participation and productivity. Modernizing clean energy distribution networks also yields structural supply-side gains, reducing long-term budgetary costs.
Evaluating social security reforms requires balancing long-term financial stability, economic performance, and social equity. Progressive reform advocates argue that raising or eliminating the income cap subject to payroll taxes would address the risk of social security fund depletion. This would prevent across-the-board benefit cuts or increases in the retirement age for manual workers while protecting the purchasing power of vulnerable retirees and restoring equity between salaried workers and high-income earners.
Standing back from all this, we must remember that our financial systems are an invention of mankind — a social construct. The public has been conditioned to believe that we must heed the iron laws of the market, that public investment is wasteful and that cutting taxes will somehow magically pay for itself. But history tells a different story: post-war governments funded massive infrastructure, built the middle class, and managed their national debts down by deploying public spending to unleash the multiplier effect of human productivity. The Laffer Curve was a convenient excuse to justify permanent redistribution upward, while real economic growth has always emerged from the bottom up, driven by the collective energy of people actually doing the work. The path ahead for American public finance is admittedly fraught with institutional inertia and political cowardice, but it is entirely solvable the moment we stop pretending money is a scarce natural resource we must scrape together from billionaires and start recognizing it as a collective administrative tool we can use to build a society worth living in.